18%
Overtime spend reduced
Recorded across three enterprise accounts within eight weeks of dashboard adoption.
A custom ETL layer turned raw Harri exports into daily KPI dashboards for labor cost and turnover.
18%
Overtime spend reduced
Recorded across three enterprise accounts within eight weeks of dashboard adoption.
3
Enterprise accounts
The measured reduction was observed across three hospitality operations.
Daily
KPI refresh cadence
Labor cost, turnover, and shift-fill views update from automated exports each day.
Operating Context
Raw workforce exports became a daily decision layer. The system normalized labor data, calculated a small set of operating KPIs, and surfaced overtime and turnover patterns early enough for managers to act.
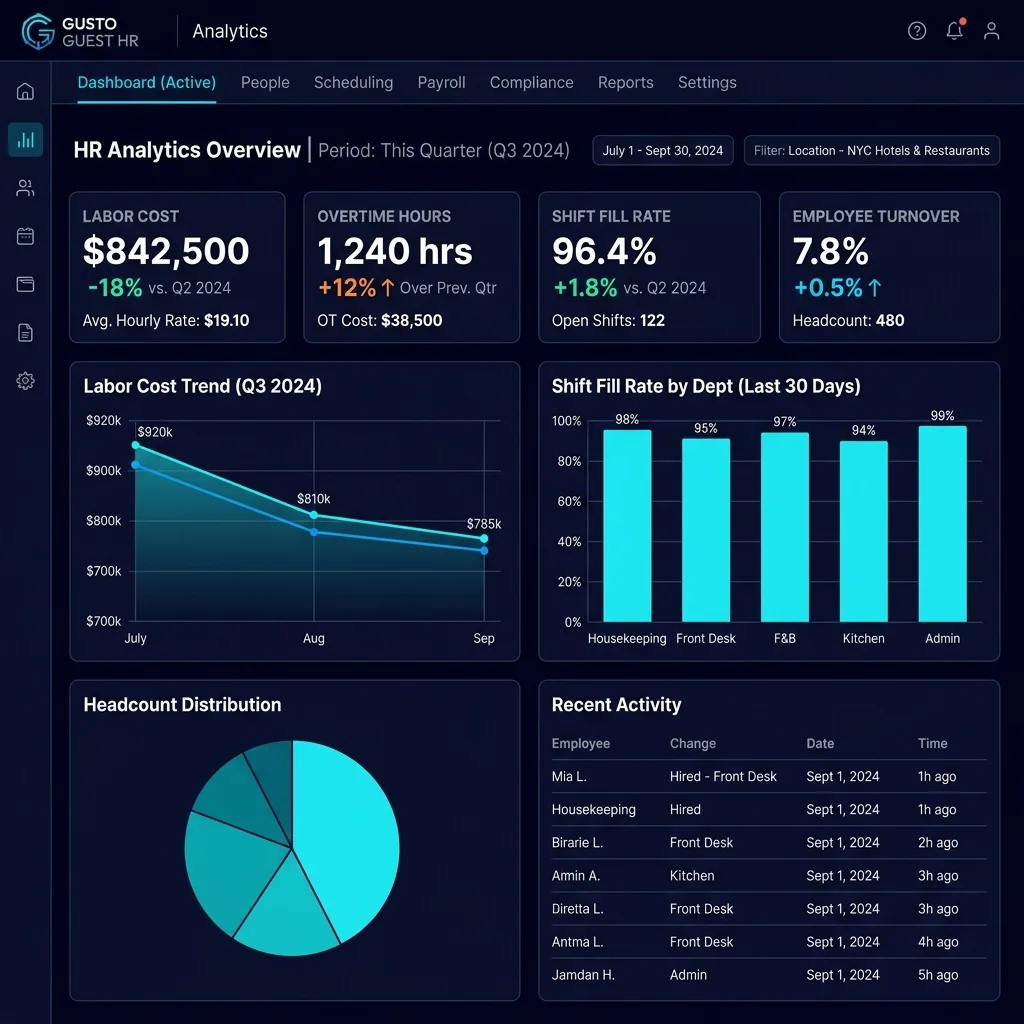
Hospitality managers using the Harri platform had raw shift and labor data but no way to spot trends: overtime abuse, high-turnover roles, and scheduling inefficiencies were invisible.
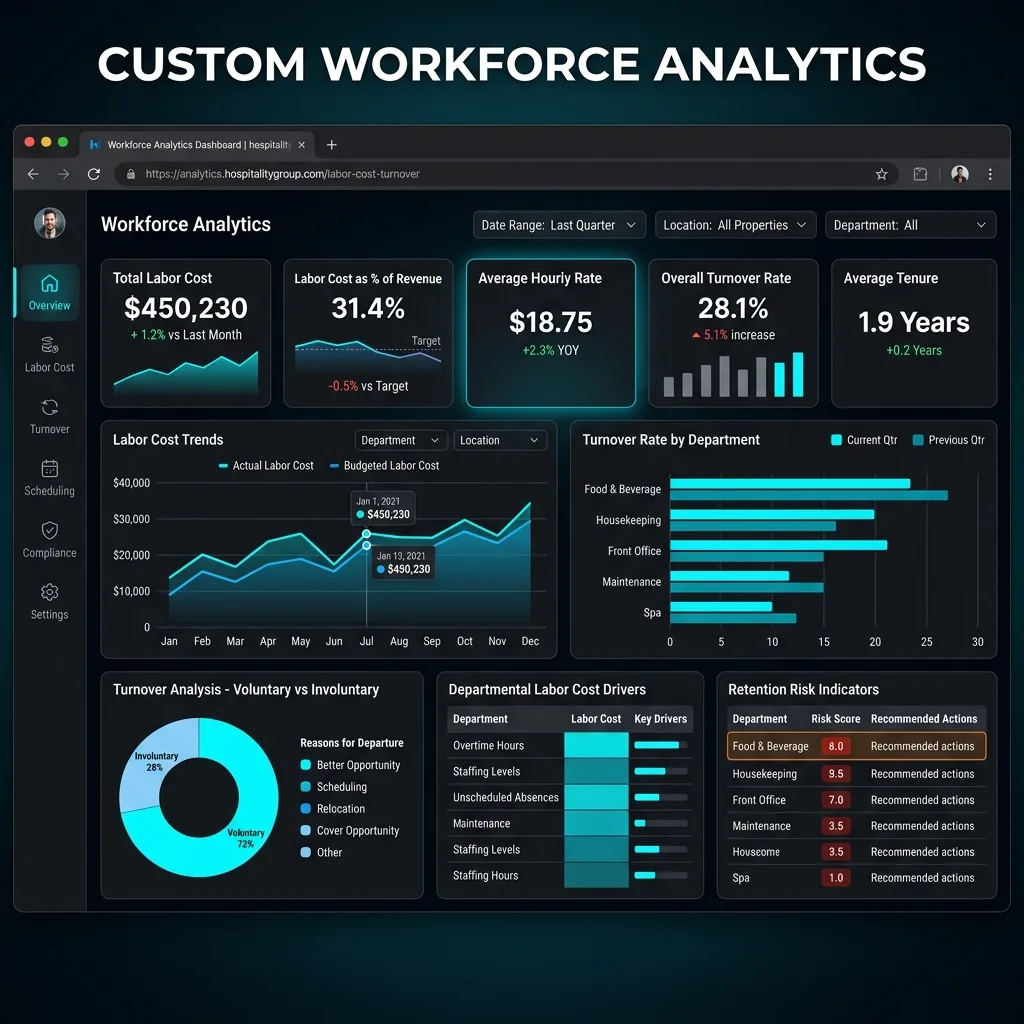
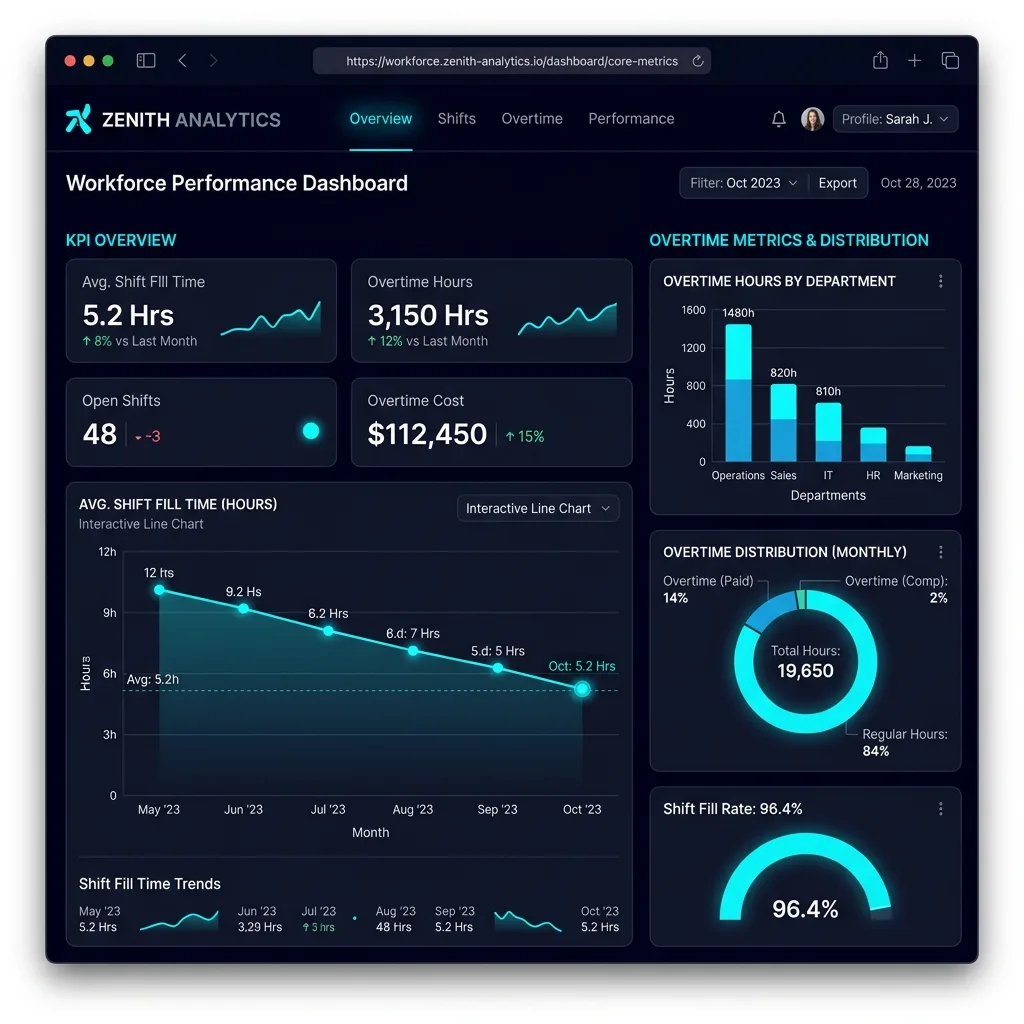
Built a custom analytics layer on top of Harri's data exports: automated ETL pipeline, KPI dashboards for labor cost, turnover rate, and shift fill time, updated daily.
3 enterprise accounts reduced overtime spend by 18% within 8 weeks of using the dashboards. Turnover hotspots identified and actioned for the first time.
Architecture
Scheduled Harri exports enter an automated processing pipeline.
Python and SQL clean the fields and align account-level workforce definitions.
The KPI layer calculates labor cost, turnover rate, overtime, and shift-fill time.
Power BI views surface daily exceptions and trends for operating managers.
Delivery Conditions
Judgment
Cleaning and KPI logic live upstream, keeping dashboard views consistent as source exports change.
The reporting layer highlights overtime, turnover, and fill-time problems instead of asking managers to inspect every row.
A daily cadence matched the management decision cycle while keeping the pipeline simpler and more reliable.
Similar Operational Problem?